
Ultimate Guide to Returns Data Analytics
Returns are a growing challenge for e-commerce businesses, with U.S. retailers managing $890 billion in returns in 2024. Online return rates hit 24.5%, significantly higher than the 5%-10% seen in physical stores. Each return costs 20%-65% of the item's value, making returns a major expense. But with data analytics, businesses can reduce return rates, recover revenue, and improve processes.
Key Takeaways:
- Top Metrics to Track: Return rate, cost per return, refund processing time, and resale recovery.
- Insights from Analytics: Identify problem products, improve sizing charts, and refine marketing.
- Customer Feedback: Understand why returns happen (e.g., "too small" or "not as described") and fix root causes.
- Technology Tools: Platforms like Navexa streamline real-time data tracking and integration across systems.
- Impact: Businesses using analytics have cut returns by up to 20%, boosted exchanges, and saved on labor costs.
Returns data isn't just a cost center - it’s a resource. By analyzing patterns and acting on insights, companies can improve profits and customer satisfaction.
Ecommerce Returns: The #1 Challenge Costing Retailers Millions | Risk & Revenue
sbb-itb-ed0a9d1
Key Metrics to Track in Returns Analytics
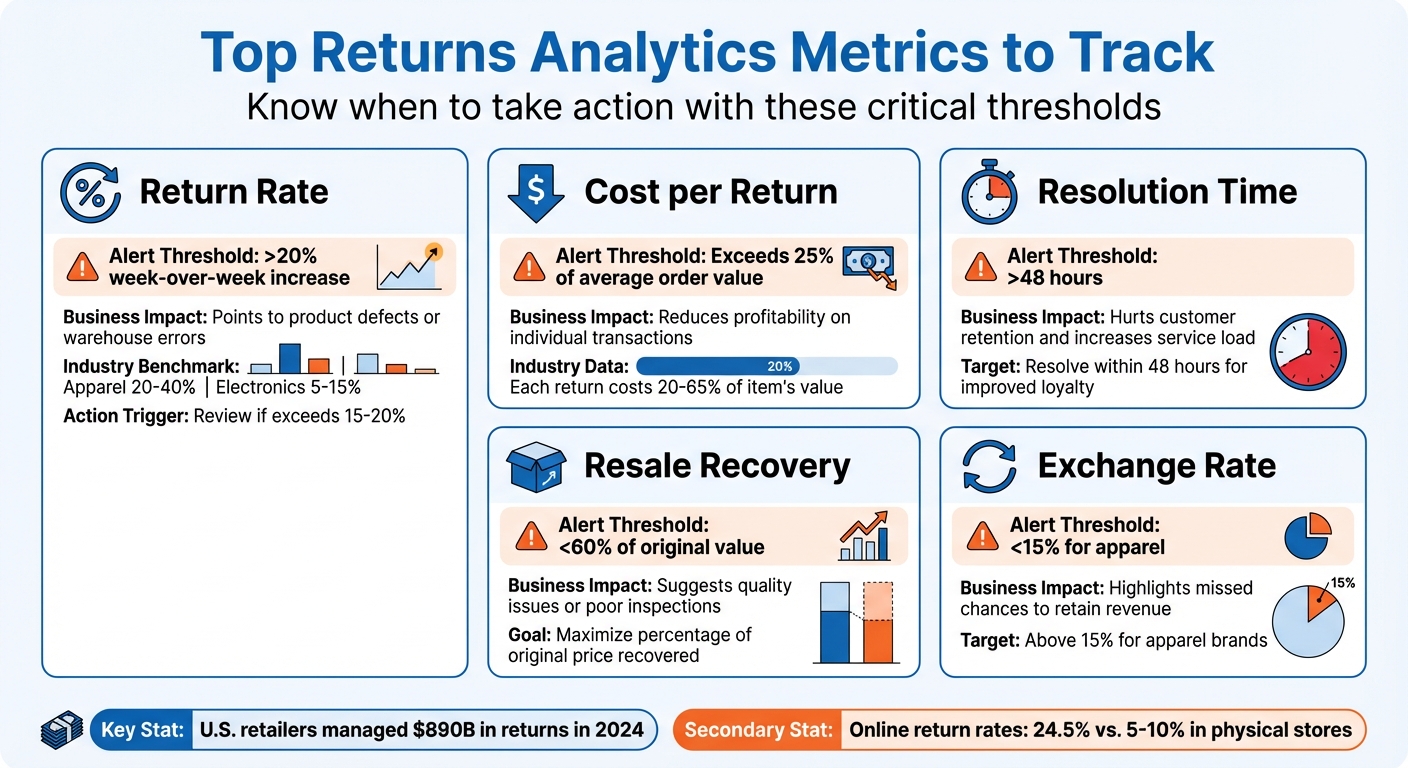
Returns Analytics Key Metrics and Alert Thresholds for E-commerce
Top Returns Analytics Metrics
Tracking key metrics is essential for businesses aiming to turn returns into an advantage rather than a drain on resources. Among these, return rate by product, variant, or category stands out. This metric pinpoints which items are causing the most returns, helping businesses address potential issues. For example, return rates for apparel typically range from 20% to 40%, while electronics hover around 5% to 15%. If a product’s return rate exceeds 15% to 20%, it’s time to review product images, size charts, and optimizing packaging to ensure product fit.
Understanding return reasons is equally important. Grouping returns into categories like "too small", "damaged", or "not as described" can uncover recurring problems that need fixing. A negative return-to-order differential - where a product’s returns outpace its sales - signals a product that needs urgent attention. Time-to-return is another critical metric, especially for seasonal items. A 30-day average return time can leave up to 75% of last month’s returns unresolved, reducing the resale value of trendy or time-sensitive products.
Refund processing time measures how quickly a return is resolved, from initiation to completion. Resolving returns within 48 hours can improve customer loyalty and reduce service inquiries. Meanwhile, cost-per-return sheds light on the financial impact of returns, including shipping, labor, and lost resale value. If this cost exceeds 25% of the average order value, it’s a clear sign that reverse logistics need reevaluation. The refund versus exchange rate offers insight into revenue retention; for instance, apparel brands should aim for exchange rates above 15% to retain more revenue. Lastly, resale value recovery tracks the percentage of the original price recouped through restocking, refurbishing, or liquidation.
| Metric | Alert Threshold | Business Impact |
|---|---|---|
| Return Rate | >20% week-over-week increase | Points to product defects or warehouse errors |
| Cost per Return | Exceeds 25% of average order value | Reduces profitability on individual transactions |
| Resolution Time | >48 hours | Hurts customer retention and increases service load |
| Resale Recovery | <60% of original value | Suggests quality issues or poor inspections |
| Exchange Rate | <15% for apparel | Highlights missed chances to retain revenue |
These metrics are not just numbers - they should directly align with strategic objectives to drive meaningful improvements.
Linking Metrics to Business Goals
To make these metrics actionable, businesses need to tie them to their broader goals. For instance, return processing time and cycle times can guide warehouse staffing decisions, ensuring the team is prepared for seasonal return spikes.
Cost-per-return plays a key role in cost-reduction strategies by exposing inefficiencies in reverse logistics. Rising transportation costs, for example, might indicate the need to renegotiate shipping rates or establish regional return centers. Utilizing multi-carrier rate shopping can also help identify the most cost-effective shipping options for returns. Similarly, return rate by product informs inventory decisions - high-return items should be withheld from reordering until their issues are resolved. On the revenue side, improving refund versus exchange rates can help retain funds by encouraging store credit or exchanges instead of outright refunds.
Sharing return reason data across departments creates a feedback loop that can prevent future returns. For example, if "fabric feels cheap" is a common complaint among customers, the product development team can address material quality in the next production cycle. This collaboration also allows marketing teams to refine campaigns and customer service teams to proactively address recurring issues, ultimately reducing the operational burden of handling avoidable returns.
Analyzing Returns Data for Useful Insights
Finding Patterns in Returns
Breaking down returns data into segments can uncover patterns that lead to actionable solutions. For instance, analyzing product attributes - like SKU, category, material, or color - can highlight specific problem areas. A retailer might notice that non-stretch fabrics are frequently associated with "too small" complaints, offering a clear area for improvement.
Looking at customer segmentation adds another perspective. By examining returns based on demographics, purchase history, and loyalty tier, businesses can distinguish their most valuable customers from those who incur higher costs. For example, the top 5% of customers by order volume with return rates under 20% are deemed "A+ Customers", while the top 5% by return volume with refund ratios over 50% are categorized as high-return customers. This analysis allows businesses to adjust return policies - offering perks like expedited processing for loyal buyers while creating barriers for repeat abusers.
Geographic and channel analysis can reveal mismatches in customer expectations. Comparing return rates across sales channels - like Instagram versus a direct website - might show that some marketing strategies set unrealistic expectations. Regional insights are also valuable. For example, a surge in snow boot returns during the holiday season may point to sizing issues with gifts rather than personal purchases.
Temporal analysis offers another layer of insight. Tracking returns over time or during specific promotions can highlight seasonal spikes, helping businesses prepare by adjusting inventory or staffing levels in advance. Additionally, AI-powered tools can detect anomalies, such as sudden increases in defect reports or suspicious patterns like "wardrobing" (buying items with the intent to return after use).
These insights create a foundation for addressing the root causes of returns through direct customer feedback.
Using Customer Feedback to Fix Root Causes
While data segmentation shows what’s happening, customer feedback explains why. Organizing return reasons - like "too small", "damaged in transit", or "not as described" - helps separate issues businesses can control from those they cannot. For example, when 98% of shoppers abandon purchases due to poor product descriptions, improving images and specifications becomes an obvious way to reduce returns.
Feedback about sizing can be particularly helpful. If "too large" complaints repeatedly appear for a specific product line, businesses can update their sizing charts or add guidance like "runs large - consider sizing down" directly on product pages.
Quality control insights are another critical area. When customers frequently report defects or dissatisfaction with materials - such as "fabric feels cheap" - this feedback should go to the product development team for future adjustments. Similarly, tracking "damaged in transit" complaints by carrier or route can highlight logistics or packaging issues that need attention.
Using post-purchase questionnaires during the return process is another effective way to gather feedback. Automated tools can present simple multiple-choice questions when customers initiate a return, allowing businesses to collect detailed reason codes without adding hassle. This structured input creates a feedback loop that benefits multiple teams - marketing can refine messaging, operations can improve packaging, and customer service can address recurring issues proactively.
Strategies to Reduce Return Rates Using Analytics
Use analytics to turn insights into actionable steps that help prevent returns. By examining product pages, customer interactions, and return policies, you can address potential issues before a purchase even happens.
Improving Product Information
Did you know that 56% of returns happen because the product doesn’t match its online description? That makes refining your product pages a top priority. Start by analyzing the return-to-order differential to identify items with higher-than-average return rates.
"When a customer returns a product... It means that the customer's expectation of the product did not match the reality of the product." - ReturnLogic
Use customer feedback to improve details like sizing charts, especially if size mismatches are a common issue. AI-powered size recommendation tools have shown to reduce size-related returns by up to 35%. Adding model details - such as height, weight, and the size they’re wearing - can also help customers better visualize how an item might fit.
For products with frequent "not as described" or "color misinterpreted" returns, enhance your visual content. Features like 360° views, video demonstrations, and clear scale references can help set accurate expectations. If analytics show that non-stretch fabrics often lead to fit complaints, include a note on the product page, such as recommending customers size up for a better fit.
These adjustments ensure customers have a better understanding of what they’re purchasing, reducing the chances of post-purchase disappointment.
Engaging Customers Before Purchase
Once your product details are clear and accurate, focus on engaging customers before they hit "buy." Tools like live chat and AI-driven sizing assistants can address questions in real time, helping customers make informed decisions.
Segment your data by sales channel to identify where additional support or more detailed product info might be needed. For high-risk products, proactive outreach - like follow-up emails with care instructions or sizing reminders - can further reduce return rates.
Improving Return Policies and Processes
Data from product performance and customer interactions can help you fine-tune your return policies to balance cost savings with customer satisfaction. For example, offering warranties instead of refunds can lower the overall refund rate by 10%.
Customer segmentation is key here. Loyal shoppers with low return rates could receive perks like free return shipping or faster processing, while higher-risk customers might face stricter terms. One electronics retailer used monthly scorecards based on return analytics to overhaul their supplier quality management program. The result? A 68% drop in quality-related returns and $1.8 million in annual savings on return processing costs.
Analyzing resolution times by product category or return reason can also reveal inefficiencies. For example, delays in packaging or carrier instructions can be addressed to streamline the process. Sharing these insights across departments allows marketing teams to adjust messaging, operations teams to refine packaging, and product developers to improve future designs.
Using Technology for Returns Analytics
The right tools can completely change how businesses handle returns data - helping them collect, analyze, and act on it more effectively. With 31% of retailers stating that returns significantly impact their profit margins, having the right technology in place isn't just helpful - it's necessary for staying competitive.
How Analytics Platforms Support Returns Management
Modern analytics platforms give businesses full visibility into the returns process. From the moment a customer hits "request return" to when the item is restocked or discarded, every step can be tracked in real time.
Take Navexa's real-time analytics dashboard as an example. Designed for e-commerce brands, this platform integrates returns tracking with overall fulfillment operations. This means you can monitor how returns impact shipping costs, inventory levels, and operational efficiency - all while centralizing returns data from over 50 e-commerce platforms.
One key feature to look for in these platforms is SKU-level insights. This allows you to dig into specific product variants and identify recurring issues. For instance, if a particular shoe size keeps getting returned with feedback that it’s "too narrow", you could update the product description to better manage customer expectations.
Financial tracking is another must-have. A good platform should measure total refunds, revenue recovered through exchanges, and the full cost of returns - including logistics, labor, and restocking. Without clear analytics, businesses can face up to 42% more complexity in managing their return cycles.
"We're finally able to see the big picture behind our returns. It's been a gamechanger to be able to discover specific problems in our workflows and then dig deeper on how to resolve it." – ReverseLogix Customer, Management Sector
Advanced features like filtering and segmentation let you analyze returns data by product type, customer demographics, region, or time period. This helps you catch trends or anomalies early, giving you the chance to address root causes before they grow into bigger problems. The result? A unified system where all returns data comes together seamlessly.
Connecting Returns Data Across Systems
To take analytics further, connecting returns data across all systems is essential. Returns aren’t isolated - they’re part of the broader customer journey. API integrations with tools like warehouse management systems, CRM platforms, POS systems, and e-commerce platforms ensure a comprehensive view of operations. While implementing these integrations can take 4 to 6 weeks, the payoff is a 360-degree view of the returns lifecycle, enabling every department to make smarter decisions.
For teams without advanced technical resources, exportable formats like CSV, JSON, or Excel allow for manual analysis and reporting across systems. However, automating data flow reduces errors and ensures insights are always up-to-date.
Standardizing data across all channels - whether online or in-store - is another critical step. If return reasons are labeled inconsistently (e.g., "wrong size" versus "fit issue"), your analysis will lack accuracy. Consistent categorization ensures reliable insights, helping you pinpoint areas for improvement and take meaningful action.
Building a Returns Analytics Framework
Turning key metrics and insights into meaningful operational improvements requires a structured framework. While technology plays a role, it’s the framework itself that ensures analytics drive results. Without it, even the best data can fall flat.
Setting Up Data Collection Processes
The first step is gathering returns data from every possible touchpoint. This includes systems like warehouse tracking, logistics platforms, CRM tools, POS systems, and e-commerce platforms. Organize your data collection into three levels:
- Basic data: Details like who returned the item, the reason for the return, timing, and the condition of the item.
- Advanced data: Customer feedback, carrier performance, and processing efficiency.
- Predictive data: Historical trends that help forecast future returns.
Using self-service return portals with standardized questionnaires can simplify this process. For example, reasons like "size too small", "damaged in transit", or "not as described" can be captured quickly and consistently.
It’s also critical to ensure compliance with privacy regulations, such as GDPR in Europe or CCPA in California, depending on where your business operates.
Once you have a reliable data collection system, the next step is setting clear KPIs and objectives to turn that data into actionable insights.
Setting Clear KPIs and Objectives
Defining success starts with breaking your metrics into clear categories:
- Financial KPIs: Track metrics like cost per return, total refund value, and net margin impact. This last metric includes lost gross profit, processing costs, and the recovery value of resold items.
- Product KPIs: Focus on return rate by SKU, top return reasons, and frequently returned items to identify potential quality or description issues.
- Customer Behavior KPIs: Analyze repeat purchase rates, customer lifetime value, and preferred return options (refund, exchange, or store credit) to gauge loyalty.
- Operational KPIs: Measure efficiency with metrics like average resolution time and return turnaround time.
"By tracking relevant KPIs, you can get a better understanding of how your online store is performing and make informed decisions to improve your profitability and customer retention."
- Rebecca Lazar, ReturnGO
Segmenting your data by channel, geography, product category, and customer type can reveal improvement opportunities. For example, bubble charts can highlight products that need immediate attention. Instead of relying on industry averages, set targets based on the performance of your best-performing products in each category.
After defining KPIs, the next step is to create feedback loops that ensure insights lead to action.
Creating Feedback Loops for Ongoing Improvement
Returns data should drive action across departments like Customer Experience, Operations, Finance, and Merchandising. Each return reason should connect to a specific remedy. For instance:
- If customers frequently return an item because it runs small, update the product description with detailed fit notes or a sizing chart.
- If a particular SKU shows a high defect rate, notify the product development team to investigate manufacturing issues.
- If returns spike in a specific region, work with the logistics team to review carrier performance or adjust packaging standards.
The goal is to build a closed-loop system where returns data sparks action, and the impact of those actions is measured over time. For example, if you revise a product description based on return feedback, monitor whether its return rate decreases over the next 30 to 60 days. This continuous cycle of refinement ensures your analytics framework evolves with your business needs.
Measuring the Impact of Returns Analytics
After setting up a returns analytics framework, the next step is proving its value. This involves calculating the financial return on your investment and linking analytics-driven changes to measurable business results.
Calculating Returns Analytics ROI
The formula for ROI is straightforward: (Final Value – Investment) / Investment. Alternatively, you can calculate it as (Profit / Costs) x 100 to express it as a percentage. The key is pinpointing where the gains come from.
One of the clearest metrics is retained revenue, which tracks how much money stays in your business through exchanges or store credit instead of being lost to refunds. For instance, Underoutfit, an activewear company, introduced store credit and variant exchanges between 2023 and 2024. Co-Founder Felix Leshno led this initiative, which cut refund rates by 25.6%. The store credit option also added 16.4% in new revenue, as customers often spent more than their credit value. Additionally, variant exchanges made up 19.8% of all returns.
Operational efficiency savings are another area to measure. Travelpro, a luggage brand, automated its returns process under eCommerce Operations Manager Mark Costigliola. This reduced the time spent processing each return from 15–20 minutes to just 90 seconds. The result? Significant labor cost savings and the ability to handle higher return volumes during busy holiday seasons.
Other ROI drivers include inventory recovery, reduced reverse logistics costs through "keep-the-item" policies, and fraud prevention. To calculate labor savings specifically, compare the time spent on manual processing versus automated processing and multiply this by your employees’ hourly wages.
These metrics are more than just numbers - they reflect real business improvements.
Business Outcomes from Analytics
Returns analytics doesn’t just boost ROI; it also enhances net profit, customer lifetime value, and brand reputation.
Net profit sees a direct impact when refunds are replaced with exchanges. Take Silk & Salt, an eco-conscious fashion brand, as an example. By implementing automated returns and store credit, they reduced refunds by 24.1%. When customers used their store credit, they spent an average of 24.9% more than their original order.
"In apparel commerce, it's very important to know how to benefit from your reverse logistics, and not drown in it."
- Assaf Neuman, Head of Operations, Silk & Salt
Customer lifetime value also improves when the returns process is seamless. Research indicates that 62% of shoppers are more likely to return to a retailer after a positive returns experience. This leads to lower customer acquisition costs and higher repeat purchase rates.
Finally, brand reputation gets a boost. Analytics helps identify and address issues like sizing inconsistencies or product defects before they escalate. Returns can cost retailers up to 3.8% of their total sales due to lost revenue and operational expenses. By using data to reduce return rates, you safeguard both profits and customer trust. Automation alone can cut returns processing costs by up to 30%.
Conclusion
An effective returns analytics strategy can turn what might seem like a $743 billion headache into a competitive advantage. Returns don’t have to be a drain on profitability. Each return - whether due to sizing issues, processing delays, or customer dissatisfaction - offers valuable insights that can refine your products, marketing efforts, and operations.
The businesses thriving in this area don’t just monitor refund rates. They connect returns data across their operations to uncover patterns, address issues proactively, and optimize processes. For example, identifying recurring sizing problems before they escalate, encouraging exchanges instead of refunds, and cutting handling times all contribute to improved net profit, higher customer lifetime value, and smoother operations.
As Returnalyze puts it:
"Data-driven decision-making can transform returns from a cost center into a strategic asset." - Returnalyze
Despite the clear benefits, only 24% of companies are fully data-driven. Meanwhile, 62% of consumers are more likely to shop again with retailers who provide a positive returns experience, and 96% review return policies before making a purchase. These numbers highlight how critical returns management is to both customer acquisition and retention.
Platforms like Navexa make this process more seamless by integrating real-time analytics with your existing systems. With tools that monitor shipping, inventory, and fulfillment, businesses can detect trends faster and reduce processing costs by as much as 30%. Automated workflows and performance tracking create feedback loops that drive continuous improvement, enabling actionable changes that ripple across your operations.
A practical place to start? Focus on one metric. Track it consistently, make one targeted improvement, and build from there. This step-by-step approach mirrors the framework outlined earlier. Companies succeeding in returns management didn’t achieve overnight success - they began with data, made incremental adjustments, and measured the impact of each change.
FAQs
How does data analytics help e-commerce businesses reduce return rates?
Data analytics plays a crucial role in helping e-commerce businesses tackle one of their biggest challenges: high return rates. By digging into returns data and combining it with purchase behavior, companies can uncover the why behind product returns. Is it a sizing problem? A quality issue? Or maybe product descriptions that leave customers confused? Identifying these patterns allows businesses to make targeted fixes, like improving product descriptions, enhancing quality control, or offering more accurate sizing guides.
But the benefits don’t stop there. Returns data also provides insights that can refine product offerings and streamline supply chain operations. For example, if a specific product is frequently returned for the same reason, it might be time to rethink its design or adjust how it’s marketed. Aligning customer expectations with the actual product can lead to fewer returns and happier customers.
In essence, data analytics transforms returns from a setback into an opportunity for smarter decisions and sustainable growth.
What metrics should I track to manage product returns effectively?
To handle product returns efficiently, it’s crucial to keep an eye on a few important metrics:
- Return rate: This metric indicates the percentage of items returned compared to total sales. It helps gauge the overall scale of returns and spot potential issues.
- Return reasons: Understanding why customers return products - whether it’s due to sizing problems, defects, or other factors - can uncover trends that point to areas needing improvement.
- Processing time: Tracking how long it takes to process returns is essential. Faster processing can boost customer satisfaction and help cut down operational expenses.
By monitoring these metrics, businesses can uncover patterns, refine their return policies, and improve the customer experience. Plus, incorporating returns data into your broader analytics efforts can help lower return rates, streamline workflows, and safeguard your revenue.
How can customer feedback from returns data improve product descriptions?
Customer feedback from returns data plays a key role in refining product descriptions. When a product is returned, it often signals a mismatch between customer expectations and the product's actual features, quality, or usability. By digging into this data, businesses can uncover patterns and address recurring issues, leading to more precise and helpful descriptions.
For instance, returns data might point out missing or unclear details about sizing, materials, or usage instructions. Updating these areas ensures that product descriptions align more closely with the actual product, empowering customers to make well-informed choices. This not only reduces the chances of future returns but also strengthens customer trust and satisfaction. Plus, fewer returns mean lower operational costs - a win-win for both businesses and their customers.
Ship your next order through Navexa.
Connect a store, buy a label, and see the numbers yourself.