
How Real-Time 3PL Analytics Improve Fulfillment
Real-time 3PL analytics solve one of the biggest pain points in e-commerce: lack of visibility in fulfillment. These tools provide live insights into order accuracy, shipping speed, carrier performance, and inventory levels, empowering businesses to reduce errors, cut costs, and improve delivery timelines.
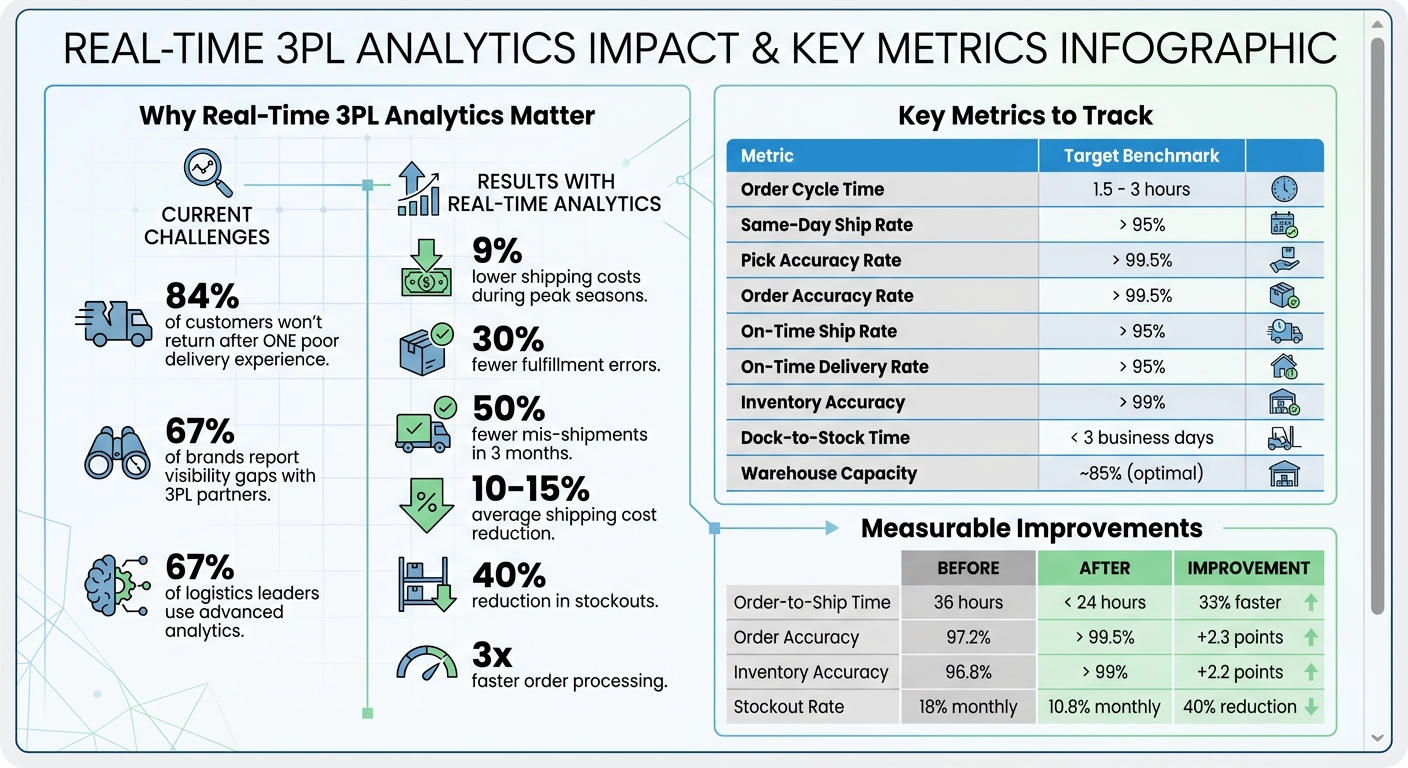
Here’s why it matters:
- 84% of customers won’t return after one poor delivery experience.
- 67% of brands report visibility gaps with their 3PL partners.
- Businesses using real-time analytics have seen:
- 9% lower shipping costs during peak seasons.
- Up to 30% fewer fulfillment errors.
- 50% fewer mis-shipments in just three months.
By integrating real-time data from WMS, TMS, and carrier APIs, companies can act instantly to resolve issues like delays, inventory mismatches, or inaccurate orders. Platforms such as Navexa are leading the charge, helping e-commerce brands streamline operations and achieve measurable improvements in customer satisfaction and profitability.
Key Metrics to Track:
- Fulfillment Speed: Same-day ship rates > 95%.
- Order Accuracy: Pick accuracy > 99.5%.
- On-Time Delivery: Delivery deadlines met > 95%.
- Inventory Accuracy: Stock accuracy > 99%.
With the right tools, businesses can optimize every stage of fulfillment, ensuring better performance and happier customers.
Real-Time 3PL Analytics: Key Metrics and Performance Benchmarks
Using Power BI to track real-time deliveries of a 3rd-Party logistics business

sbb-itb-ed0a9d1
Key Metrics Tracked by Real-Time Analytics Tools
Real-time analytics track essential fulfillment metrics, helping 3PL operations move away from guesswork and toward data-driven decisions. With over 67% of logistics leaders utilizing advanced 3PL analytics to enhance speed and accuracy in their operations, it’s clear these tools are reshaping the industry. By focusing on four main metrics - fulfillment speed, order accuracy, on-time delivery rate, and inventory levels - businesses can assess and refine every stage of the fulfillment process, from order placement to delivery.
Fulfillment Speed
Order Cycle Time measures how quickly a 3PL moves from receiving an order to creating a shipping label. While the industry average is about 28 hours, top-tier operations can complete this process in as little as 1.5 to 3 hours. Speed is crucial for maintaining marketplace performance, including factors like Buy Box rankings.
Metrics like Same-Day Ship Rate - the percentage of orders shipped the same day they’re received - are key indicators of efficiency. Best-in-class operations aim for rates above 95%. Similarly, Order-to-Ship Time tracks the hours from order receipt to carrier scan, with a target of under 24 hours. By analyzing these metrics down to individual workstations, businesses can identify and address bottlenecks in picking, packing, or carrier handoffs.
Order Accuracy
Delivering orders accurately is critical, as even minor mistakes can erode profitability by up to 13% due to returns, replacement shipping, and customer service costs. Moreover, 16% of customers may stop buying from a brand after just one incorrect shipment.
Pick Accuracy Rate focuses on whether warehouse staff select the correct items, with benchmarks exceeding 99.5%. Adding barcode scanning at both picking and packing stages can improve accuracy from about 98% to 99.7%.
Order Accuracy Rate ensures orders include the right items, quantities, and shipping details. If accuracy rates fall below 99%, businesses should consider slotting audits to reorganize SKUs that look similar, reducing the likelihood of human error. This targeted approach avoids unnecessary, large-scale changes across the warehouse.
On-Time Delivery Rate
On-Time Ship Rate measures whether orders leave the warehouse in time to meet carrier deadlines. It’s important to differentiate between when an order is marked as "complete" and when the carrier actually picks it up. Joel Malmquist, VP of Customer Experience at G10 Fulfillment, highlights that delays between these two steps can significantly impact customer satisfaction.
On-Time Delivery Rate tracks whether packages reach customers by their promised delivery date. Using real-time analytics to monitor carrier performance can help pinpoint regional delivery issues, such as ZIP code-specific delays, and address them before they escalate. This visibility is essential, as 69% of shoppers are less likely to make repeat purchases after experiencing late deliveries.
Inventory Levels
Accurate inventory tracking is vital for smooth operations further down the line. Real-time systems help bridge the gap between physical stock and system records, preventing overselling and reducing inventory distortion, which can lead to financial losses.
Inventory Accuracy measures how closely system counts match physical stock, with a target of at least 99%. Implementing a Warehouse Management System (WMS) can improve accuracy by up to 20%. If accuracy dips below 95%, it may signal the need for more advanced 3PL solutions.
Dock-to-Stock Time tracks how quickly inbound inventory becomes available for sale after arriving at the warehouse. The goal is to keep this under three business days to avoid false stockouts. Additionally, monitoring Warehouse Capacity Utilization helps maintain efficiency. Operations tend to slow down when capacity exceeds 90%, while keeping utilization around 85% prevents congestion.
Analytics also support ABC classification, which organizes inventory based on movement speed. High-velocity SKUs (Class A) are assigned to optimal pick zones, ensuring top-sellers are easily accessible while minimizing excess stock in slower-moving categories.
Here’s a quick summary of these key metrics and their benchmarks:
| Metric | Definition | Target Benchmark |
|---|---|---|
| Order Cycle Time | Time from order receipt to label creation | 1.5 - 3 hours |
| Same-Day Ship Rate | Percentage of orders shipped the same day if received by cutoff | > 95% |
| Order Accuracy Rate | Percentage of orders with correct items, quantity, and address | > 99.5% |
| On-Time Ship Rate | Percentage of orders meeting carrier cutoffs | > 95% |
| Inventory Accuracy | Match between system count and physical count | > 99% |
| Dock-to-Stock Time | Days from purchase order arrival to inventory being available for sale | < 3 business days |
How Real-Time Analytics Optimizes Inventory Management
Real-time analytics transforms inventory management from guesswork into precise, actionable decisions. By bridging the gap between physical stock movement and system records, it helps tackle a major issue that costs the global retail industry a staggering $1.73 trillion annually in inventory distortion.
Inventory Forecasting
Predictive analytics tools, such as Random Forests and Neural Networks, analyze historical data to uncover seasonal trends and detect demand spikes. These insights provide a real-time view of demand, enabling businesses to make informed decisions.
One critical aspect of inventory forecasting is distinguishing between "on-hand" inventory and "available-to-sell" stock. Real-time availability analytics take into account allocations, picks, and reservations as they happen. This ensures you’re not mistakenly promising inventory that's already committed to another order - a vital feature for businesses operating across platforms like Amazon, Shopify, and Walmart.
Automated reorder points, calculated based on consumption rates, help maintain optimal stock levels. These systems often include confidence scores and stockout predictions, allowing you to act before a problem arises rather than scrambling to fix it after the fact. Platforms like Navexa integrate inventory forecasting with real-time analytics, offering a streamlined approach to maintaining accurate stock levels.
These forecasting tools naturally extend into strategies that help prevent both stockouts and overstocking.
Reducing Stockouts and Overstocking
Real-time forecasting precision is further enhanced by continuous updates, which prevent inventory errors. For example, real-time tracking updates stock counts instantly whenever a barcode is scanned or an item is moved. This eliminates phantom stock - inventory that appears available in the system but doesn’t physically exist. With barcode scanning and IoT sensors, these updates occur automatically, reflecting warehouse activity in real time.
Unlike perpetual inventory systems, which update during transactions but may lag behind actual activity, real-time systems continuously sync data. This difference is crucial for high-volume operations, such as 3PL warehouses, where even short delays can result in overselling. Notably, 50% of all warehouse management system deployments are now cloud-based, allowing for seamless data syncing across devices and locations.
To maintain accuracy, it’s essential to enforce scanning at every stage - receiving, picking, packing, and shipping. Simplify workflows to make scanning faster and easier than manual alternatives. Additionally, monitoring integration sync logs between your warehouse management system and sales channels can help identify and correct data discrepancies before they escalate.
For businesses that deal with kits or bundles, advanced real-time systems automatically adjust inventory levels for individual components as soon as a kit is assembled or sold. This eliminates the need for manual calculations and ensures accuracy. Such precision is particularly important in regulated industries like food or supplements, where tracking lot numbers and expiration dates is crucial for managing recalls and ensuring compliance.
Improving Carrier Performance with Real-Time Insights
As businesses move toward more proactive fulfillment management, real-time carrier insights are becoming essential for refining logistics strategies. By leveraging real-time analytics, companies can evaluate carrier performance with live, actionable data rather than outdated reports. This approach provides a clear view of shipment performance as it unfolds, uncovering patterns that traditional methods might overlook. Such insights are crucial for measuring key performance indicators (KPIs) in carrier operations.
Carrier Performance Metrics
A centralized dashboard allows businesses to compare carrier performance across regions, service levels, and delivery zones on an even playing field.
One critical metric to monitor is the total cost of fulfillment, which goes beyond the base shipping rate. This metric includes additional factors like accessorial fees, surcharges, labor costs for handling customer service issues, and refunds due to carrier-related failures.
"Using shipping software that's connected to the APIs of the carriers, we can rate shop multiple carriers all at once... We're going to find the most cost-effective shipping rate for the service that has been defined for that package."
- Holly Woods, Director of Operations, G10 Fulfillment
Carrier performance often varies by region. For example, a carrier might excel in one area, such as the West Coast, but struggle in another, like the Midwest. Real-time analytics help identify these trends, enabling smarter routing decisions based on destination. Automated alerts, such as notifications when a carrier's on-time delivery rate falls below 90%, ensure small issues are addressed before they escalate.
Warehouse scanning also plays a key role in accurate performance tracking. Connor Perkins, Director of Fulfillment at G10 Fulfillment, highlights this importance:
"You want everything to be scanned in the warehouse, nothing done on paper. Scanning gives you the timestamps that fuel performance reports. Paper workflows offer guesses. Scanning provides proof."
By combining these metrics with real-time data, businesses can refine their multi-carrier strategies for better results.
Optimizing Multi-Carrier Strategies
While multi-carrier rate shopping helps find the cheapest label for each shipment, real-time analytics ensure those carriers deliver on their promises. The lowest upfront rate doesn’t always equate to the lowest overall cost.
Navexa offers a platform that integrates multi-carrier rate shopping with real-time performance analytics. This combination has helped e-commerce brands cut shipping costs by an average of 10–15%. For instance, in 2026, Bloom & Wild’s Head of Operations, Sarah Chen, reported a 12% reduction in shipping costs during their first month using Navexa’s analytics and box optimization tools.
Navexa’s approach goes beyond basic rate comparisons. It examines weight-break data to identify when packages slightly over certain thresholds - like 4.4 pounds - cause sharp rate increases. This insight allows businesses to optimize packaging and stay within lower cost brackets. Additionally, analytics can reveal instances where ground services deliver to specific zones as quickly as express air services, enabling cost savings without sacrificing delivery speed.
In November 2025, apparel retailer ICIW implemented unified tracking and automated updates, cutting "Where Is My Order" (WISMO) inquiries by 50%. With 84% of customers valuing order tracking as a high-priority feature, reliable tracking data not only enhances satisfaction but also provides a competitive edge.
Historical performance data also proves valuable in negotiations. For example, presenting reports that show a carrier only met its two-day delivery promise 78% of the time can help secure service credits or better rates, backed by clear, data-driven evidence.
Implementing Real-Time Analytics in Your 3PL Operations
Switching to real-time analytics requires careful planning, seamless integration, and a precise understanding of where your operations fall short. Before committing to any platform, take the time to audit your current processes. Identify where delays occur, pinpoint manual workarounds your team relies on, and note any areas where data accuracy falters. This step is crucial - it ensures you’re choosing tools that solve real problems instead of adding unnecessary layers of complexity. With this analysis in hand, you’ll have a clearer path to selecting the right tools for your needs.
Choosing the Right Tools
When it comes to analytics platforms, focus on solutions designed specifically for third-party logistics (3PL) rather than generic warehouse management systems. Look for features tailored to 3PL operations, such as multi-client management, white-label portals for customers, and automated billing per client. Strong API integrations are essential too, especially for e-commerce, accounting, and carrier systems.
Cloud-based platforms are becoming the norm, now making up 50% of warehouse management deployments. These systems offer scalability and mobile access - key features for today’s fast-paced fulfillment environments. Also, prioritize tools that allow unlimited user access. If cost restrictions limit how many staff can use the system, manual workarounds might creep back in, undermining the accuracy of your data. For instance, Navexa offers integration with over 50 platforms and provides real-time analytics dashboards specifically designed for e-commerce fulfillment. This includes multi-carrier rate shopping and instant performance tracking.
"In a high-velocity warehouse, if your data isn't live, it's already obsolete."
Be mindful of hidden costs like implementation fees, per-transaction charges, and overage penalties - they can significantly inflate your total expenses. Pay attention to integration logs to catch any data drift that could signal poor API performance. During your platform evaluation, test how well the system syncs with your sales channels. If inventory counts don’t align across systems, it’s a red flag for potential issues. Choosing a platform designed for 3PL needs ensures that your operations benefit from real-time insights.
Once you’ve selected the right tools, the next step is setting up automation to streamline your workflows.
Setting Up Automated Workflows
Automation transforms real-time data into operational efficiency. Start by integrating your e-commerce platforms, warehouse management system (WMS), and transportation management system (TMS) using APIs to eliminate manual data entry. To handle high order volumes without overloading APIs, use message queues like RabbitMQ or Amazon SQS.
Pre-fulfillment validation is another critical step. Automate address verification to catch misspellings or flag restricted addresses, such as PO Boxes or military locations, at the order source. Sync products automatically by mapping internal SKUs to 3PL identifiers using UPC/EAN barcodes.
Real-time barcode scanning at every stage of the process ensures accurate tracking of item movements. To improve visibility, combine instant webhooks for status updates like "Packed" or "Shipped" with periodic reconciliation polling every 1–4 hours. This hybrid approach not only maintains data accuracy but also reduces costly "Where Is My Order?" inquiries, which typically cost $5–$8 per ticket in agent time. Additionally, smart packing automation can help determine the best box sizes, while real-time rate shopping ensures you select the most cost-effective carrier for each shipment.
A phased rollout can help you refine these workflows before full-scale implementation. This gradual approach minimizes disruption and allows time for staff training. Make sure to define clear status mappings that translate 3PL-specific terms like "Picking" or "Awaiting Carrier" into customer-friendly language. By leveraging live data at every step, you can deliver seamless fulfillment operations backed by precise, real-time insights.
Measuring Improvements from Real-Time 3PL Analytics
Once real-time analytics are in place, the next step is proving their impact. Shifting from guesswork to solid data transforms your relationship with your 3PL provider into a partnership built on shared accountability. To do this effectively, start by setting clear baselines before implementation and then monitor specific metrics to measure progress.
Before and After Analysis
Begin by comparing key performance metrics from before and after adopting real-time analytics. For speed-related metrics, focus on median values rather than averages. Averages can be skewed by outliers, such as delays during busy holiday seasons, while medians provide a clearer picture. Track these metrics monthly to identify trends and uncover hidden "cost creep" that may not be obvious in aggregate invoices.
Here’s a snapshot of the improvements typically seen after implementing real-time analytics:
| Metric | Before Analytics | After Analytics | Improvement |
|---|---|---|---|
| Order-to-Ship Time | 36 hours (median) | < 24 hours (median) | 33% faster |
| Order Accuracy Rate | 97.2% | > 99.5% | 2.3 points higher |
| Inventory Accuracy | 96.8% | > 99% | 2.2 points higher |
| Stockout Rate | 18% of SKUs monthly | 10.8% of SKUs monthly | 40% reduction |
To prioritize improvements, assign weights to your KPIs based on what matters most to your business. For instance, a growth-stage company might weigh Accuracy at 30%, Speed at 25%, Cost at 20%, Exception Handling at 15%, and Communication at 10%. This weighted scorecard approach provides a single performance score tailored to your business goals.
These operational improvements often translate into direct cost savings.
Quantifying Cost Savings
The efficiency gains from real-time analytics lead to measurable savings across shipping, inventory, and processing costs. One of the most immediate areas of savings is shipping optimization. For example, Sarah Chen, Head of Operations at Bloom & Wild, shared how using Navexa led to a 12% reduction in shipping costs during the first month:
"Navexa cut our shipping costs by 12% in the first month. The box optimization alone paid for the entire platform."
- Sarah Chen, Head of Operations, Bloom & Wild
To calculate your own savings, start by determining your cost per order. Divide your total monthly fulfillment invoice by the number of orders processed. Next, analyze carrier invoices for hidden fees, such as accessorial charges, incorrect surcharges, or billing errors flagged by analytics tools. Also, compare your carrier discounts to industry benchmarks to ensure competitive pricing. Emily Watson, Founder & CEO of Glow Recipe, used Navexa for inventory forecasting, which helped reduce stockouts by 40%.
In addition to shipping, monitor inventory health to identify savings. By tracking consumption rates and stockout predictions, you can reduce excess inventory, freeing up capital. Businesses that adopt logistics analytics often see profit increases of up to 20%, while advanced fulfillment platforms typically deliver around a 12% cost reduction through smarter recommendations. Additionally, order processing can become up to three times faster with real-time synchronization and batch operations.
Regular measurement and analysis of these metrics ensure your fulfillment processes remain efficient and cost-effective over time.
Conclusion
Real-time 3PL analytics have become a cornerstone of e-commerce fulfillment. With 84% of customers unwilling to return to a store after just one poor delivery experience, the pressure to ensure fast and accurate fulfillment has never been greater. These analytics tools can deliver impressive results - cutting shipping costs by 10–15%, reducing stockouts by 40%, and tripling order processing speeds.
The key to success lies in addressing issues before they escalate. By leveraging real-time data on receiving delays, picking efficiency, and carrier performance, teams can resolve inefficiencies that might otherwise disrupt delivery timelines. It's no surprise that over 67% of logistics leaders already use advanced analytics to improve operational speed and reduce cost-per-order. Additionally, most shippers are planning to ramp up their technology investments by 2026, signaling a clear shift toward more advanced, data-driven operations. This visibility enhances every aspect of fulfillment, from better inventory oversight to improved carrier management.
Platforms like Navexa highlight the transformative power of these tools. They provide centralized solutions to streamline multi-carrier strategies, use 3D bin packing algorithms to optimize packaging, and automate inventory reorder points. As Marcus Rodriguez, VP of Logistics at Urban Outfitters, puts it:
"We ship 10,000+ orders daily and Navexa handles it flawlessly. The multi-carrier rate shopping is a game-changer."
- Marcus Rodriguez, VP of Logistics, Urban Outfitters
FAQs
What counts as “real-time” in 3PL analytics?
In the context of 3PL analytics, "real-time" refers to instant updates on inventory levels, orders, and warehouse activities. This is made possible by tools such as warehouse management systems and barcode scanners, which automatically record changes as items move through the system. By removing delays caused by manual updates or waiting for end-of-day reports, businesses can make faster, smarter decisions based on up-to-the-minute information.
Which fulfillment KPIs should I prioritize first?
Focusing on the right KPIs can boost both efficiency and customer satisfaction. Some critical metrics to keep an eye on include:
- Dock-to-stock time: This measures how quickly inventory is available, ideally within 24 hours.
- Order accuracy: Ensuring orders are fulfilled correctly to meet customer expectations.
- Real-time visibility: Tracking bottlenecks and monitoring SLA compliance to keep operations running smoothly.
By leveraging these insights, businesses can fine-tune their processes, cut down on delays, and maintain top-notch service levels. The result? A supply chain that’s more agile and responsive to customer needs.
How do I connect my WMS, TMS, and carriers to real-time dashboards?
Integrate your WMS (Warehouse Management System), TMS (Transportation Management System), and carriers into one unified platform to bring all your data together. By using APIs or built-in integrations, you can achieve real-time visibility into crucial aspects like inventory, order status, and shipping performance.
A centralized dashboard makes it easy to monitor everything in one place. You'll have continuous insights into carrier performance, fulfillment progress, and inventory levels, allowing you to keep operations running smoothly and efficiently.
Ship your next order through Navexa.
Connect a store, buy a label, and see the numbers yourself.