
Carrier Scorecards: 10 KPIs to Measure Success
When choosing a shipping carrier, data-driven decisions are key. Carrier scorecards help you track performance objectively, ensuring your logistics operations are efficient and cost-effective. Here are 10 KPIs every business should monitor:
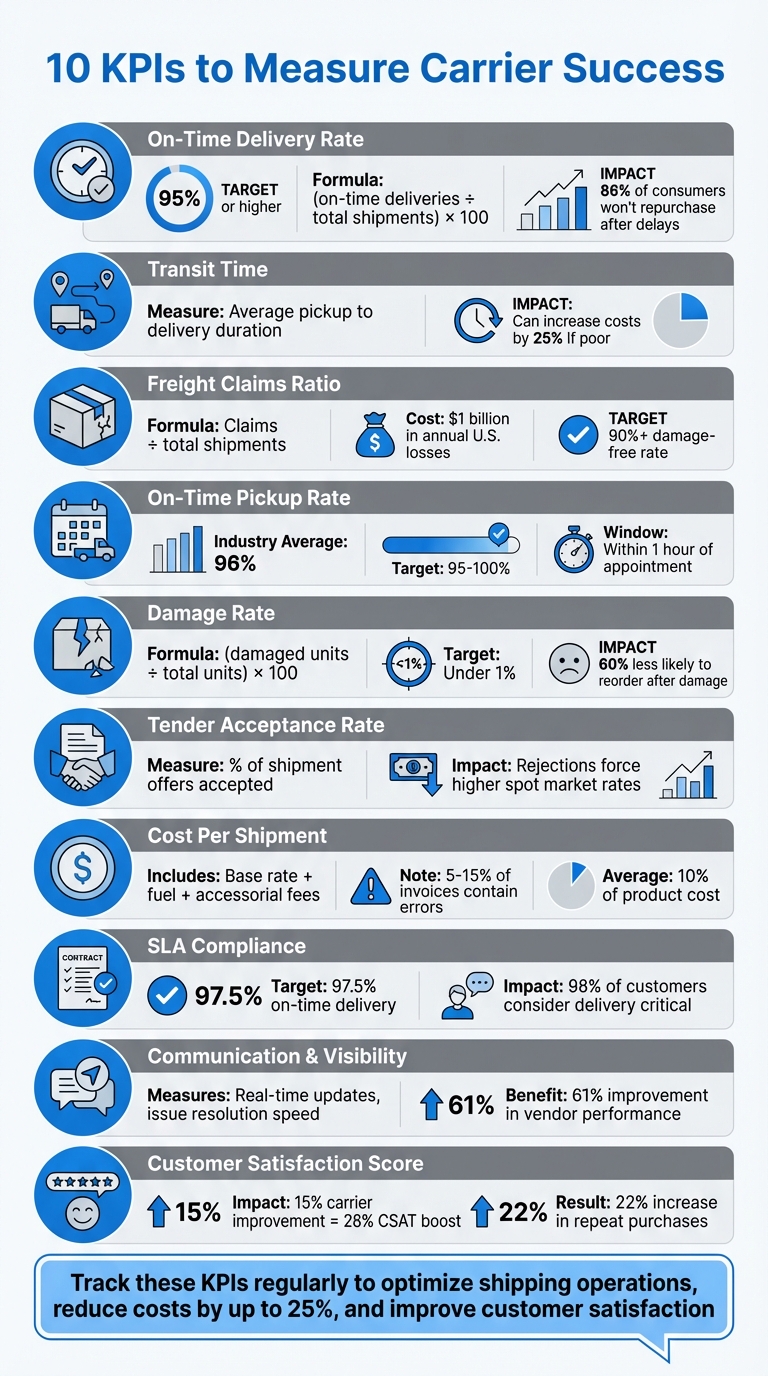
- On-Time Delivery Rate: Measures how often shipments arrive as scheduled. A target of 95% or higher minimizes delays and improves customer trust.
- Transit Time: Tracks the time it takes for shipments to reach their destination, helping identify bottlenecks and improve efficiency.
- Freight Claims Ratio: Indicates how often shipments are damaged or lost. Lower ratios signal better carrier reliability.
- On-Time Pickup Rate: Ensures carriers collect shipments within agreed timeframes, reducing disruptions.
- Damage Rate: Tracks shipment quality, with top carriers maintaining damage rates under 1%.
- Tender Acceptance Rate: Measures how often carriers accept shipment requests, highlighting reliability.
- Cost Per Shipment: Includes all shipping expenses, helping manage budgets and compare carriers.
- SLA Compliance: Tracks adherence to service-level agreements, ensuring carriers meet agreed standards.
- Communication and Visibility: Evaluates real-time updates and issue resolution, crucial for smooth operations.
- Customer Satisfaction Score: Combines performance data with customer feedback to measure overall service impact.
These metrics provide actionable insights to optimize shipping operations, cut costs, and improve customer satisfaction. Tracking them regularly ensures stronger carrier partnerships and better business outcomes.
10 Essential Carrier Performance KPIs for Shipping Success
5 LTL Carrier Scorecard Metrics Shippers Should Track
1. On-Time Delivery Rate
The On-Time Delivery (OTD) rate is calculated as:
(on-time deliveries ÷ total shipments) × 100.
For instance, if a carrier successfully delivers 950 out of 1,000 packages on time, their OTD rate would be 95%.
Defining "On-Time" for Precise Performance Measurement
How you define "on-time" plays a critical role in evaluating carrier performance. Some businesses track delivery accuracy by the day, while others demand hour-level precision. Katy Keane, President of Koncatenate, highlights that many shippers consider a delivery on time if the truck arrives "within one hour before or after an appointment". To get a clearer picture of performance, independently tracking transit times is essential. This level of precision directly impacts how efficiently operations run.
Operational Efficiency Benefits
Measuring OTD accurately leads to more streamlined operations. High OTD rates reduce the need for rework, such as dealing with customer complaints, processing refunds, or responding to inquiries. On the other hand, poor OTD performance can result in late fees, unexpected charges, and disruptions in warehouse schedules. Even small delays can snowball; for example, a 4-minute delay across 600 shipments adds up to 40 hours of lost productivity.
The Connection to Customer Satisfaction
Late deliveries can severely damage customer trust. Statistics show that 86% of consumers are unlikely to repurchase after a delay, and 69% actively avoid retailers following just one late shipment. With 60% of customers now expecting two-day shipping as the norm, meeting delivery deadlines is no longer optional. As Alexander Jarvis puts it, "The On-Time Delivery Rate (OTD) stands as the cornerstone metric of carrier performance in ecommerce".
Cost Implications of Poor OTD Performance
Falling short on OTD can increase logistics costs by as much as 25%. Beyond the initial shipping expenses, poor delivery performance often leads to additional costs like refunds, expedited replacements, and administrative efforts to resolve customer complaints. Setting a target of 95% or higher for OTD in your service-level agreements (SLAs) can help minimize these hidden costs.
2. Transit Time
Transit time refers to the average duration it takes for a shipment to travel from pickup to delivery. While On-Time Delivery (OTD) evaluates whether deliveries meet deadlines, transit time provides a deeper look at the actual time it takes for goods to reach the customer.
Accuracy in Measuring Carrier Performance
Tracking transit time independently is key to maintaining an unbiased view of carrier performance. As Joe Lynch from The Logistics of Logistics explains, "To maintain integrity, it is important to track the actual transit time, rather than rely on the carrier's data". By comparing actual delivery times to a carrier’s promised windows, businesses can determine whether contractual commitments are consistently met. Additionally, analyzing transit times across various shipping zones helps establish realistic benchmarks for performance in different regions.
Automating real-time data collection removes the risk of human error and eliminates reliance on potentially biased carrier data. These insights provide a solid foundation for improving operations and enhancing customer service.
Impact on Operational Efficiency
Transit time data is more than just a performance metric - it’s a tool for operational improvement.
For instance, analyzing transit times can help identify bottlenecks caused by carrier delays, inefficiencies at distribution centers, or internal routing problems. This data also supports strategies like zone skipping, which reduces shipping distances and costs by bypassing unnecessary stops. Additionally, businesses can strategically position warehouses closer to high-demand areas, cutting delivery times and improving efficiency. Setting up automated alerts to flag when a carrier’s transit time falls below agreed thresholds ensures small issues are addressed before they grow into larger problems.
Relevance to Customer Satisfaction
Transit time plays a critical role in shaping the customer experience. Delays can have serious consequences: 86% of consumers say they won’t shop with a retailer again after a late delivery, and 69% actively avoid retailers with a history of delays. Meeting or exceeding transit time expectations is essential for building customer loyalty and encouraging repeat business.
Cost-Effectiveness
Transit time performance isn’t just about speed - it’s also about managing costs. Inefficient carrier operations can drive up logistics expenses by as much as 25%. Shorter transit times, particularly in lower shipping zones, help reduce shipping costs and improve profit margins. Regularly reviewing transit time performance against service level agreements (SLAs) - at least once a quarter - ensures businesses are getting the service they’re paying for.
3. Freight Claims Ratio
Keeping track of performance consistently is key to uncovering hidden problems in carrier operations with tools to ship smarter.
The freight claims ratio measures how often claims are filed compared to the total number of shipments. You can calculate it in two ways: either by dividing the number of claims by the total shipments or by dividing the total cost of loss and damage claims by the total freight costs. This metric sheds light on a carrier's accountability for damaged or lost goods.
Accuracy in Measuring Carrier Performance
This KPI provides clear, measurable data, cutting out any bias in evaluating carriers. Using percentages instead of raw numbers ensures a fair comparison between carriers of different sizes. For example, a carrier with 100 claims out of 10,000 shipments performs better than one with 50 claims out of 1,000 shipments. Experts also suggest tracking all types of damage, even minor ones like scratches or loose packaging, whether or not formal claims are filed. These details, while small, can still impact the customer experience. By capturing this level of detail, you not only improve carrier comparisons but also gain a better understanding of how these issues affect operations.
Impact on Operational Efficiency
A high freight claims ratio can create operational headaches. Filing claims, conducting investigations, reprocessing orders, and rushing replacements all pull resources away from more productive tasks. This metric also helps pinpoint where problems are happening - whether it’s in how carriers handle goods, packaging issues, or routing inefficiencies. For Less-Than-Truckload (LTL) carriers, where shipments are handled multiple times during consolidation, keeping an eye on this ratio is especially important.
Relevance to Customer Satisfaction
Freight damage doesn’t just disrupt operations; it leaves a mark on your customers. Delivery quality is often the last interaction customers have with your brand. As Rob Martinez, Partner at Navigo Consulting Group, explains:
"The quality of delivery - on time and in good condition - has enormous impact on customer satisfaction, return rates and repeat sales".
Damaged shipments can lead to refunds, returns, and unhappy customers who may associate their poor delivery experience with your company.
Cost-Effectiveness
The financial toll of a high claims ratio goes far beyond the cost of the damaged goods themselves. In the U.S., damaged shipments rack up losses of about $1 billion annually. For companies spending $40 million on transportation, these issues could add up to $4 million in avoidable costs. Administrative expenses related to resolving disputes and compensating for damages only make the problem worse. Carriers with damage-free rates of 90% or higher are typically seen as reliable performers.
4. On-Time Pickup Rate
The on-time pickup rate measures how often carriers arrive to collect shipments within the agreed-upon time window. To calculate it, divide the number of on-time pickups by the total scheduled pickups. Industry standards usually define "on-time" as arriving within one hour before or after the scheduled appointment. On average, the on-time pickup rate is 96%, with about 40% of companies setting their performance goals between 95% and 100%. Tracking this metric goes hand-in-hand with monitoring on-time deliveries, creating a more complete picture of carrier performance. Just like delivery times, consistent pickup performance plays a key role in ensuring smooth logistics operations.
Accuracy in Measuring Carrier Performance
This KPI acts as an early indicator of potential issues with carrier reliability. RXO puts it this way:
"Supply chain KPIs work the same way [as a blood pressure reading]. If your freight providers fail to meet your benchmarks... it is a red flag that you need to dive deeper".
To ensure accurate tracking, use tools like a Transportation Management System (TMS), EDI/API integrations, or even manual logs to verify pickup times. Avoid relying solely on data provided by the carrier. This method helps pinpoint whether delays are a systemic issue with the carrier or isolated to specific routes or locations.
Impact on Operational Efficiency
Late pickups can throw your supply chain into disarray, delaying shipments and forcing costly rescheduling. These delays often stem from capacity constraints, which can lead to misrouted loads and damage your brand's reputation.
Relevance to Customer Satisfaction
The reliability of pickups directly affects your ability to meet delivery commitments. When pickups are consistent, delivery forecasts become more accurate, boosting customer trust and reducing the likelihood of returns.
Cost-Effectiveness
Poor pickup performance can significantly inflate logistics costs. Delays and inefficiencies in carrier operations can drive up overall expenses by as much as 25%. Frequent delays not only lead to lost sales but also increase customer service expenses as teams scramble to address complaints and find solutions. Maintaining a high on-time pickup rate - ideally 90% or better - helps avoid costly expedited logistics and minimizes additional charges like detention fees or late penalties.
5. Damage Rate
The damage rate tracks how often shipments are damaged during transit. To calculate this, divide the number of damaged units by the total units shipped, then multiply by 100. Top carriers usually keep damage rates under 1%, making this a solid benchmark for evaluating performance. Beyond just assessing how well shipments are handled, this metric can highlight deeper issues like equipment maintenance, route planning, or operational weaknesses. It’s a key indicator of both operational efficiency and customer satisfaction.
Accuracy in Measuring Carrier Performance
Damage rates provide a clear, objective way to gauge a carrier's commitment to quality. Using percentage-based values allows for fair comparisons, even when carriers handle different shipping volumes. As Alexander Jarvis explains:
"Pristine packages reflect a carrier's quality commitment. Your damage rates directly influence customer satisfaction and your brand's reputation."
By analyzing patterns in damaged shipments, companies can identify whether problems are caused by carriers, internal packaging issues, or warehouse practices. Monitoring routes and equipment can also uncover trends, such as older or poorly maintained trucks leading to higher damage rates.
Impact on Operational Efficiency
Damaged shipments create a ripple effect of inefficiencies. Teams must spend time filing claims, investigating issues, issuing refunds, and coordinating replacements. These disruptions can drive up logistics costs significantly - claims for damaged shipments can cost around $3,000 each, and high damage rates can increase overall expenses by up to 25%. Nationwide, damaged shipments result in losses of approximately $1 billion annually.
Relevance to Customer Satisfaction
Damage rates have a direct impact on customer trust and loyalty. Receiving damaged goods can leave a lasting negative impression - customers are 60% less likely to reorder after receiving broken products. Even minor damage, like scratches or loose components, can frustrate customers and lead to returns or replacement requests, ultimately harming brand reputation.
Cost-Effectiveness
Beyond operational setbacks, high damage rates can significantly inflate costs due to claims and replacements. To address this, businesses can include specific damage rate thresholds in Service Level Agreements (SLAs), along with penalties or incentives to encourage better handling. When damage rates rise, collaborating with carriers to investigate the root cause - whether it’s related to certain transit zones, equipment, or handling practices - can lead to meaningful improvements. As Trax Technologies notes:
"A high percentage of damaged shipments can make a carrier unsuitable in order for your company to thrive in a highly competitive market."
6. Tender Acceptance Rate
After considering metrics like on-time delivery and pickup rates, the tender acceptance rate offers another layer of insight into a carrier's reliability and dedication to your business.
This metric tracks the percentage of shipment offers a carrier accepts compared to the total tenders issued. It’s a key indicator for keeping operations efficient and costs manageable. A low acceptance rate might suggest that carriers are prioritizing more profitable shipments over your business.
As Trax Technologies highlights:
"Acceptance rate is one of the best indicators of carrier performance."
Measuring Carrier Reliability
A high tender acceptance rate reflects a dependable partnership. Examining the reasons behind rejected tenders - such as unsuitable routes, equipment shortages, or pricing conflicts - can help uncover capacity-related issues. This type of analysis provides a clear, data-backed picture of which carriers consistently meet your shipping needs.
Ensuring Smooth Operations
When carriers maintain high acceptance rates, your shipping schedule remains predictable, minimizing disruptions. On the flip side, frequent tender rejections can force your logistics team to scramble for alternatives, causing delays and increasing administrative burdens. Joe Fitzpatrick from DataDocks explains:
"A high acceptance rate reduces last-minute disruptions and ensures a consistent shipping schedule."
Real-time tracking of tender acceptance rates allows you to quickly pivot to backup carriers, avoiding bottlenecks and keeping things running smoothly.
Keeping Costs Under Control
Tender rejections often push you into the spot market, where rates are usually higher than contracted prices. Considering that transportation costs make up about 10% of a product’s total cost, these rejections can significantly impact your budget. By analyzing acceptance trends, you can negotiate better terms with reliable carriers or decide when it’s time to explore other options. Nadia Brosious from FreightCenter cautions:
"If a preferred carrier frequently declines tenders, costs may increase, potentially affecting your budget."
Like other metrics discussed, monitoring tender acceptance rates is essential for evaluating carrier performance and maintaining a cost-effective supply chain.
sbb-itb-ed0a9d1
7. Cost Per Shipment
When it comes to understanding the financial impact of your shipping operations, analyzing the cost per shipment is a must. This metric doesn’t just look at base rates; it also factors in fuel surcharges, liftgate fees, after-hours pickups, and other add-ons. By digging into these details, businesses can make smarter decisions when comparing carriers and identifying ways to improve operations.
Accuracy in Measuring Carrier Performance
Shipping costs can have a big impact on your bottom line, often making up about 10% of a product’s total cost. But focusing solely on base rates won’t give you the full picture. True cost per shipment includes all those extra charges - like fees for liftgate delivery or after-hours pickups - that can quickly inflate your expenses.
Here’s another wrinkle: between 5% and 15% of shipping invoices contain errors. For a company spending $40 million on transportation, those mistakes could add up to a staggering $4 million. Breaking down costs by zone, carrier, and package size can help pinpoint where those extra expenses are coming from. For example, LTL (less-than-truckload) shipping costs per pound typically range from $0.06 to $0.75, with the majority falling between $0.22 and $0.42. This kind of data-driven insight is essential for refining both your spending and your operations.
Cost-Effectiveness
Tracking cost per shipment doesn’t just help you manage expenses - it also lets you compare carriers against industry benchmarks and against each other. Regular audits of accessorial charges can reveal inefficiencies, like long loading times or poorly planned routes. For instance, manual freight audits can cost up to $9.00 per invoice, but with optimized systems, that drops to about $2.00 per invoice.
Switching to EDI or API invoicing can also make a big difference. These methods are 81% less expensive and 77% faster than manual processing. Of course, cost isn’t the only factor - service quality matters too. A carrier charging $0.30 per pound with a 98% on-time rate might deliver far more value than one charging $0.25 per pound but struggling with delays and damage claims. Balancing these factors is key to making the best choice for your business.
8. Service Level Agreement Compliance
Service Level Agreements (SLAs) are more than just formalities - they act as a blueprint for managing carrier performance. A well-defined SLA goes beyond vague promises, setting specific benchmarks like 97.5% on-time delivery, damage rates below 1%, and detailed reporting schedules. When carriers meet these expectations, you gain leverage to claim remedies such as service credits, refunds, or even contract adjustments.
Accuracy in Measuring Carrier Performance
Monitoring SLA compliance provides a clear, impartial view of carrier performance. This consistency allows for fair comparisons across your network, whether you're dealing with regional LTL carriers or national parcel services like ShipBob and Navexa. By leveraging real-time SLA tracking, you can pinpoint the root causes of service failures and understand their financial impact. As Will Kerr, CEO of Edge Logistics, notes:
"The foundation for effective performance measurement is data transparency and quality".
Impact on Operational Efficiency
When carriers consistently meet SLA targets, your team spends less time putting out fires. Reliable performance minimizes the need to chase down late shipments or manage unexpected disruptions. Regular quarterly business reviews, supported by SLA scorecards, help identify underperformance trends early - long before they snowball into customer complaints. Additionally, precise SLA tracking reduces the risk of incorrect chargebacks and helps you decide whether higher service fees are worth the enhanced reliability. This level of precision ensures smoother operations and better alignment with customer expectations.
Relevance to Customer Satisfaction
Customer loyalty often hinges on delivery performance, with 98% of customers considering delivery a critical part of their experience. Any delivery failure, from delays to errors, reflects directly on your brand. The stakes are high: 86% of consumers avoid a retailer after a late delivery, and 16% abandon a retailer entirely after just one incorrect delivery. Furthermore, 69% of shoppers are unlikely to return after a late delivery. Enforcing strong SLA compliance not only holds carriers accountable but also safeguards your reputation. Meeting these standards helps satisfy the 93% of customers who expect delivery updates throughout the process.
9. Communication and Visibility Score
After analyzing operational and cost metrics, examining communication and visibility provides a complete picture of carrier performance. A carrier's ability to communicate effectively and offer real-time shipment updates directly affects how well you can manage your operations. This KPI assesses how proactively carriers alert you to potential delays, how accurate their tracking information is, and how quickly they respond to inquiries or resolve issues like load discrepancies. Essentially, it measures whether carriers provide critical information before problems escalate. Like other metrics, this KPI supports proactive carrier management.
Accuracy in Measuring Carrier Performance
Automated communication through EDI and API connectivity ensures timestamped data, eliminating errors from manual reporting. When carriers integrate with your Warehouse Management System (WMS) or Transportation Management System (TMS), you can see invoice processing speed up by 77% and costs drop by 81% compared to manual methods. Reliable data governance allows for accurate historical tracking and smarter procurement decisions, turning scorecards into dynamic tools that reflect the current state of carrier performance.
Impact on Operational Efficiency
Real-time visibility allows for quick adjustments, minimizing delays and avoiding productivity losses. Sharing KPI data with carriers creates a two-way relationship where they can identify and fix inefficiencies, ultimately improving the service they provide. Companies that share performance data with vendors report a 61% improvement in vendor performance overall. Accurate visibility into carrier arrival times also helps loading dock workers plan their tasks and breaks better. Even minor delays - like 4 minutes per shipment across 600 shipments - can lead to 40 hours of lost productivity or $800 in weekly labor costs at $20/hour. Managing these factors proactively not only optimizes operations but also enhances customer trust.
Relevance to Customer Satisfaction
When carriers communicate delays proactively, it allows you to manage customer expectations before frustration sets in, fostering trust and loyalty. This matters because 13% of consumers say they wouldn’t order from a retailer again if a package arrives late. Timely updates and swift issue resolution help safeguard your brand’s reputation and reduce customer churn. High responsiveness and accurate tracking information directly signal superior service quality.
Cost-Effectiveness
Automated visibility systems significantly lower administrative burdens and reduce human error. For instance, manual invoice processing costs around $9, but optimized freight audit and payment systems can cut this down to $2 per invoice - an 81% savings. Improved visibility also highlights internal bottlenecks. Shipping invoice inaccuracies affect 5% to 15% of shipments; for a company with $40 million in shipping expenses, this could mean $4 million in unnecessary costs. Real-time analytics further enable you to select the most cost-effective carrier for specific routes based on actual performance data rather than guesswork.
10. Customer Satisfaction Score
The Customer Satisfaction Score (CSAT) evaluates how well a carrier performs by combining internal data with customer feedback. This score provides a clear picture of how each delivery impacts your brand's reputation and customer loyalty. By blending measurable KPIs with customer insights, CSAT highlights whether your carrier is improving or damaging your brand perception. It serves as the final piece in the KPI framework, tying carrier performance directly to customer experience.
Relevance to Customer Satisfaction
Late deliveries and damaged goods can severely hurt customer trust. In fact, 86% of shoppers avoid retailers after experiencing delays, and 60% are less likely to reorder if they receive damaged products. These numbers highlight how delivery failures not only damage trust but also result in lost revenue. Since carriers represent your brand during the final mile, their performance has a direct impact on customer perception.
Impact on Operational Efficiency
When customer satisfaction scores are high, companies often see fewer support tickets and reduced administrative costs related to complaints. For example, improving carrier performance by just 15% can lead to a 28% boost in customer satisfaction and a 22% rise in repeat purchases. This directly reduces the burden on support teams and makes fulfillment processes smoother. By connecting carrier performance with customer experience, CSAT offers valuable insights into operational efficiency.
Cost-Effectiveness
A high CSAT can also lower customer acquisition costs. Poor carrier operations, on the other hand, can increase logistics expenses by up to 25%, and a single damaged shipment claim can cost around $3,000. To avoid these costly outcomes, it’s crucial to use real-time alerts and regular performance reviews. This ensures any issues are addressed promptly and that the scorecard accurately reflects your carrier's performance.
How Navexa Helps Track Carrier KPIs
Navexa simplifies the process of monitoring carrier performance by pulling real-time data from various sources and turning it into actionable insights. The platform provides proactive alerts for potential delays, allowing teams to address issues before they disrupt customer deliveries. Its dashboards display performance trends across different shipping zones, making it easy to identify routes or carriers that are underperforming. With automated tracking, shipments are continuously monitored, and exceptions are flagged, ensuring swift action when problems arise.
One standout feature is the multi-carrier rate shopping tool. This functionality helps businesses reduce their Cost Per Shipment while maintaining SLA compliance. By comparing base pricing and fees against industry averages, Navexa selects carriers that meet specific delivery requirements, whether it's same-day, overnight, or specialized handling. Automated rate shopping also uncovers cost trends, like identifying the most expensive routes or carriers.
Navexa's automated workflows take the hassle out of manual record-keeping by calculating precise shipping quality metrics. It even measures how quickly carriers respond to inquiries or resolve issues - a metric referred to as "Responsiveness to Resolution".
The platform doesn’t stop at real-time insights. By analyzing historical data, it identifies patterns in delivery times and damage rates, helping teams address recurring service issues more effectively. With seamless integrations across more than 50 platforms, Navexa consolidates all carrier data into a single, centralized scorecard. This combination of real-time alerts and historical analysis ensures a thorough approach to tracking and improving carrier KPIs.
Conclusion
Keeping an eye on these 10 KPIs shifts logistics from merely reacting to problems to actively managing them. Metrics like on-time delivery, damage rates, and cost per shipment allow you to spot issues early - before they snowball into customer losses. For example, about 20% of customers are likely to switch to competitors due to late deliveries. And with shipping fees eating up as much as 70% of an e-commerce shipper's budget, it’s clear that efficient logistics isn’t just important - it’s critical.
Using carrier scorecards helps you gain unbiased, data-backed insights for smarter contract negotiations and partnership decisions. Instead of relying only on carrier-provided data, build your own performance records. As Will Kerr, CEO of Edge Logistics, explains:
"If we have that [data transparency], then we can secure more stable capacity. We could avoid a lot of inefficiencies in the market that cost all of us a lot".
Automation takes this a step further. Manual spreadsheets often lead to wasted hours cleaning up data, while modern fulfillment platforms provide real-time updates and flag issues as they arise. Sharing performance metrics with vendors can transform the shipper-carrier dynamic into a true partnership, with many companies reporting noticeable improvements in vendor performance.
FAQs
How can businesses accurately track and improve their On-Time Delivery (OTD) rate?
On-Time Delivery (OTD) tracks the percentage of orders that reach customers on or before the promised date. This is a key metric for assessing carrier performance, as it directly influences customer satisfaction and reduces costs tied to late shipments.
To measure OTD accurately, businesses should log both the promised delivery date and the actual delivery time for every shipment. With tools like Navexa, you can automate the calculation of OTD percentages, spot late deliveries, and analyze trends across different carriers and routes. Regularly reviewing carrier scorecards can help identify partners who aren't meeting expectations.
Want to boost your OTD? Start by setting clear service level agreements (SLAs) with defined targets. Tools like Navexa’s multi-carrier rate shopping can help you pick the most dependable carriers. Proper inventory forecasting can also prevent last-minute shipping issues. Additionally, automating notifications to keep customers informed about any changes and conducting routine performance reviews with carriers can improve delivery reliability and build customer confidence.
What are the risks of not tracking the Freight Claims Ratio?
Keeping tabs on your Freight Claims Ratio is crucial for spotting hidden costs and inefficiencies in your shipping process. If you’re not tracking this metric, you might miss recurring problems like damaged or lost shipments. Over time, these issues can lead to higher claim payouts and leave your customers frustrated.
When businesses actively monitor the Freight Claims Ratio, they can pinpoint trouble spots, cut down on avoidable expenses, and boost carrier performance. On the flip side, neglecting this metric can drive up operational costs and tarnish your brand’s reputation.
Why are communication and visibility crucial for evaluating carrier performance?
Effective communication and clear visibility play a key role in keeping operations running smoothly and building strong relationships between carriers and shippers. These elements provide timely insights into carrier activities, helping shippers tackle potential problems early and make well-informed decisions.
With enhanced visibility, businesses can elevate service quality, cut unnecessary costs, and build trust with their carriers. This paves the way for a supply chain that’s both efficient and dependable.
Ship your next order through Navexa.
Connect a store, buy a label, and see the numbers yourself.