How to Calculate ROI for Fulfillment Technology
Want to justify investing in fulfillment technology? Start by calculating its ROI. It's all about showing how technology can save money, improve efficiency, and reduce errors. Here's the quick formula:
ROI (%) = [(Total Benefits - Total Costs) / Total Costs] × 100.
Key takeaways:
- Labor savings: Automation can cut process times by up to 50%.
- Error reduction: Automated systems achieve 99.9% accuracy, compared to 97–99% manually.
- Shipping optimization: Tools like multi-carrier rate shopping can save Tools like rate shopping can save $1 per package. per package.
- Payback periods: Many systems pay off within 1–2 years, with some achieving ROI in months.
To calculate, start with your current costs - labor, shipping, storage, and errors. Then estimate savings from technology. For example, a $500,000 investment could save $350,000 annually, delivering a 70% ROI and a payback period of 1.43 years.
The key is using real numbers, breaking down costs and savings, and presenting clear, actionable results. If you’re ready to make smarter decisions, this guide walks you through every step.
The ROI Formula for Fulfillment Technology
The Basic ROI Formula
The formula for calculating ROI is pretty straightforward: ROI (%) = [(Total Benefits - Total Costs) / Total Costs] × 100. This gives you the percentage return on every dollar you invest. For instance, if you spend $100,000 on fulfillment software and it saves you $150,000 in the first year, your ROI would be 50%.
There’s also an annualized version of ROI: ROI (%) = (Net Annual Benefits / Total Investment) × 100. This version is especially helpful when comparing technologies with different lifespans or when presenting to stakeholders who prefer an annual perspective.
Another key metric is the payback period, calculated as Total Initial Investment / Annual Net Benefits. For example, a Warehouse Management System (WMS) often has a payback period of 6–18 months, while Automated Storage and Retrieval Systems (ASRS) might take 2–4 years to pay off.
Once you’ve mastered these basics, you’ll need to tweak the calculations to reflect the nuances of fulfillment technology.
Adjusting ROI Calculations for Technology Investments
Standard ROI calculations don’t always capture the full picture when it comes to fulfillment technology. One major oversight is the time value of money - a dollar saved today is worth more than a dollar saved five years from now. To address this, you can use Net Present Value (NPV), which discounts future savings over the typical 5–10 year lifespan of automation equipment. This approach ensures your calculations reflect the true long-term value of your investment.
Another important metric is the Internal Rate of Return (IRR). Compare this to your company’s hurdle rate, or the minimum return required to justify an investment. For instance, a project with a 4-year payback period might still deliver a 25% IRR, making it a better long-term option than a project with a quicker payback but lower total returns.
Don’t forget to account for phased implementations. Many fulfillment platforms are rolled out in stages - starting with rate shopping, then moving to inventory forecasting, and finally box optimization. As each module becomes operational, your ROI grows as processes improve over time. Instead of assuming all savings occur immediately, break these benefits down by phase for a more accurate projection.
sbb-itb-ed0a9d1
Calculating ROI for Warehouse Automation
Calculating Your Current Fulfillment Costs
To evaluate the return on any fulfillment technology, you need to start with a clear understanding of your current costs. This baseline is the cornerstone of your ROI calculations. For most online retailers, fulfillment makes up 25% to 30% of total supply chain expenses, meaning even small improvements can lead to noticeable savings.
Work with actual numbers - not estimates. Pull data from your accounting system, warehouse management tools, and carrier invoices. If your data is incomplete, track all costs for two weeks and annualize the results.
Main Cost Categories
Break your fulfillment costs into distinct categories for better clarity. Shipping and carrier fees typically dominate, sometimes making up as much as 88% of total fulfillment expenses. These include base rates, fuel surcharges, residential delivery fees, and charges for special services like same-day delivery or specific time windows.
Labor costs cover everyone involved in fulfillment - from receiving inventory to processing returns. Be sure to calculate fully loaded wages, which include payroll taxes, benefits, and supervisory costs. These are usually 1.25× to 1.6× the base pay. For example, if warehouse staff earn $20 per hour, the real cost to your business is closer to $25–$32 per hour.
Other major categories include:
- Storage and warehousing: Costs for space rental (measured by pallet, bin, or cubic foot), utilities, insurance, and security.
- Packaging and materials: Expenses for boxes, envelopes, bubble wrap, and any custom inserts.
- Technology and software: Fees for systems like Warehouse Management Systems (WMS), Order Management Systems (OMS), and integration subscriptions.
- Inbound logistics: Costs to transport inventory from suppliers to your warehouse, including freight charges and import-export taxes.
For example, in May 2025, SnarkyTea CEO Jenni-Lyn Williams conducted a 30-day shipping cost audit. By switching to Shopify's discounted carrier rates, the company saved $25,454 in shipping costs during that period, projecting annual savings of about $305,448. A detailed cost breakdown like this can provide a solid foundation for assessing potential technology investments.
Finding Hidden Costs
Hidden costs can sneak up on you and have a significant impact on your ROI. Start by accounting for error-related expenses. Every mis-shipped order comes with reshipment postage, reverse logistics, lost margins, refund processing, and the customer service time needed to resolve the issue.
"Error reduction is frequently the largest hidden payoff. A mis-shipped order can cost more than a month of software fees once you include reshipment, customer service time, margin loss, and potential refunds."
Another hidden cost is stockouts. Retailers lose an estimated $349 billion annually in sales due to out-of-stock situations. Calculate how many orders you couldn’t fulfill because of inaccurate inventory data or late stock deliveries.
Manual inefficiencies also drain resources. Track how much time your staff spends on tasks like address validation, carrier selection, and booking shipments. These tasks represent opportunity costs - time that could be better spent on strategic planning or improving customer service. For instance, 15 hours per week spent on manual label creation and tracking updates translates to $21,840 annually at a loaded labor rate of $28 per hour.
Additionally, don’t overlook the cost of customer inquiries. Count how many "where is my order?" requests your team handles each month, then multiply that by your support staff’s fully loaded labor rate. These “soft” costs often go unnoticed but can add up quickly, especially during busy seasons.
Estimating Savings from Fulfillment Technology
After understanding your current costs, the next step is figuring out how much you could save. These savings are based on data and proven areas where fulfillment technology makes a difference. For example, many e-commerce businesses can reduce shipping expenses by 10–15% through tools like automated rate shopping and box optimization alone. But shipping is just one piece of the puzzle. Let’s break down the main areas where fulfillment technology drives cost reductions.
Main Savings Categories
Once you’ve established your baseline costs, here’s how fulfillment technology helps cut expenses and add value.
Labor efficiency is often the biggest area of savings. Automation can reduce process times by up to 50%, which translates directly into lower labor costs. The formula for calculating these savings is:
(Monthly orders × Minutes saved per order ÷ 60) × Loaded hourly rate.
Advanced Autonomous Mobile Robots (AMRs) can improve productivity by 40–70% and achieve 99.9% pick accuracy, far outperforming manual systems, which typically have error rates of 1–3%.
Error reduction is another big win. Automated systems deliver 99.9%+ accuracy, compared to manual processes with error rates of 1–3%. For example, a business handling 10,000 orders per month with a 2% error rate could save between $3,000 and $7,200 each month by lowering errors to 0.8%.
Shipping optimization saves costs through live rate comparisons, 3D box optimization to avoid dimensional weight fees, and automatic access to volume discounts. Automated rate shopping typically saves about $1 per package. A business shipping 15,000 packages monthly could save approximately $15,000 per month or $180,000 per year.
Inventory and space optimization helps reduce dead stock and avoid costly stockouts. Stockouts alone cost retailers around $349 billion annually in lost sales. Predictive analytics and Warehouse Management Systems ensure you stock the right items in the right quantities. High-density Automated Storage and Retrieval Systems (AS/RS) can also double or triple storage capacity within the same physical space.
Increased order capacity enables businesses to handle two to three times more orders without expanding warehouse space. Automated Micro-Fulfillment Centers (MFCs) can process 600+ units per hour, compared to fewer than 100 in manual setups.
Here’s a quick comparison of fulfillment methods:
| Fulfillment Method | Cost per Order | Pick Time per Unit | Delivery Window |
|---|---|---|---|
| Manual Warehouse | $10 to $15 | 71 to 114 seconds | 2 to 5 days |
| Automated MFC | $3 to $5 | 20 to 64 seconds | Same day to 2 hours |
| Dark Store (Manual) | $6 to $9 | 33 to 76 seconds | Same day |
| Third-Party 3PL | $5 to $12 | Varies | 1 to 3 days |
Support deflection is another way to save. Automated tracking and proactive alerts reduce "Where Is My Order?" (WISMO) inquiries. The savings formula here is:
(Tickets Deflected × Minutes per Ticket) ÷ 60 × Support Labor Rate.
For instance, if your team handles 200 WISMO tickets per month at 8 minutes each, with a loaded hourly rate of $28, you could save about $746 monthly.
Calculating Multi-Year Benefits
The benefits of fulfillment technology aren’t just immediate - they grow over time. That’s why building a 36-month ROI model is essential. This model should include both one-time integration costs and recurring savings. Over time, as your team becomes more skilled and order volumes increase, the returns often multiply.
Use three scenarios - conservative, base, and aggressive - to account for potential variations in order volume or labor costs. For example, a conservative model might assume only 60% of projected savings are realized, while an aggressive one could include revenue boosts from faster delivery and better conversion rates.
Different technologies have varying payback periods. For instance:
- Autonomous Mobile Robots typically pay for themselves in under 24 months, with ROI exceeding 250%.
- Packaging automation often recoups costs in 1 to 2 years, thanks to reduced material waste and fewer damage claims.
- Full warehouse automation (AS/RS) for high-volume operations usually has a 4 to 7 year payback period.
Don’t forget to factor in safety and compliance improvements, which can add an extra 3–5% to your total ROI by reducing workers' compensation claims and absenteeism. Additionally, consider avoided costs, like delaying warehouse expansions or postponing the need to hire extra staff during peak seasons.
Completing Your ROI Calculation
Step-by-Step Guide to Calculating Fulfillment Technology ROI
Once you've nailed down the costs and savings, it’s time to combine them and determine whether your investment makes financial sense. But remember, how you present these numbers is just as important as the math itself.
Step-by-Step ROI Calculation
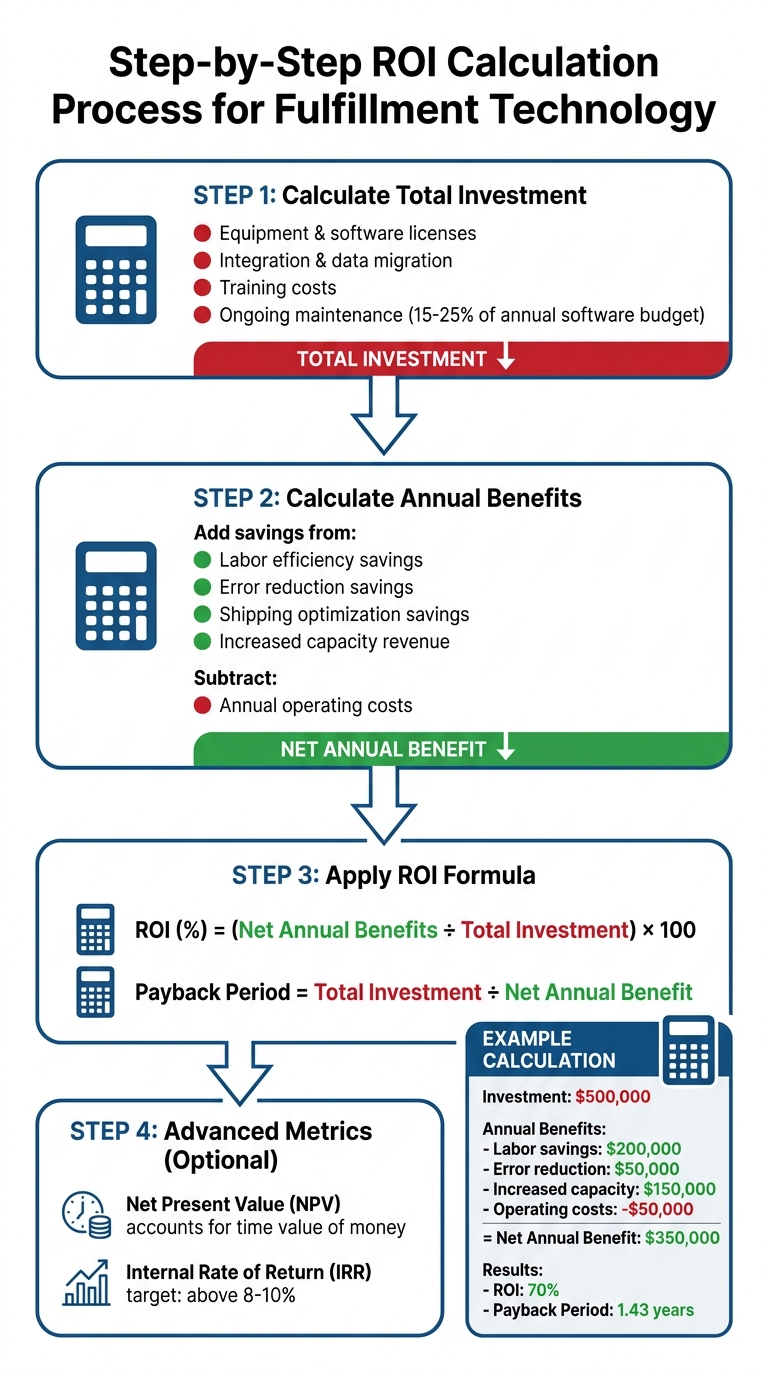
Start by calculating your total investment. This should include all upfront costs like equipment, software licenses, integration, data migration, training, and ongoing maintenance (typically 15–25% of your annual software budget). Next, figure out your annual benefits by summing up savings from areas like labor efficiency, fewer errors, optimized shipping, and added revenue from increased capacity. Subtract your annual operating costs from these savings to get your net annual benefit.
To calculate ROI, use this simple formula: (Net Annual Benefits ÷ Total Investment) × 100. Want to know how quickly you’ll recoup your investment? Divide the total investment by your net annual benefit to find your payback period. For a deeper dive, consider advanced metrics like Net Present Value (NPV) and Internal Rate of Return (IRR), which factor in the time value of money. Many companies aim for an IRR above 8–10%, so if your project clears that bar, it’s likely worth pursuing.
These calculations provide a solid foundation for making data-driven decisions.
Example Calculation
Here’s a practical example: A mid-sized e-commerce company invests $500,000 in fulfillment automation. Their annual benefits break down as follows: $200,000 from labor savings, $50,000 from error reduction, and $150,000 from increased capacity revenue. After deducting $50,000 in annual operating costs, their net annual benefit is $350,000. This results in a 70% annual ROI and a payback period of just 1.43 years.
Now, consider a smaller business example: An e-commerce store with $1 million in yearly revenue spends $9,600 annually ($800/month) on inventory automation. Their total annual benefits amount to $129,304, including $59,760 from recovered stockout revenue, $43,824 from back-in-stock notifications, and $13,680 in labor savings. The outcome? A 13.5x ROI ratio with a break-even point of just 4 weeks. On a larger scale, a $3 million goods-to-person system saved $1.3 million annually, achieved an NPV of $350,000, and delivered an IRR of 14.36% over three years.
Presenting ROI to Stakeholders
Once your ROI calculations are complete, the next step is presenting the results in a way that resonates with decision-makers. Focus on outcomes rather than technical details. Start by highlighting current challenges - long order processing times, high error rates, or peak-season bottlenecks - and then show how automation addresses these issues. For instance, instead of saying, "Efficiency will improve by 50%", frame it as, "This automation frees 12 labor hours per week, allowing us to handle 300 additional orders without overtime".
"If you can only measure one thing before buying software, measure minutes per order on your current process. That single metric usually reveals more truth than 'we feel busy' ever will." - Marcus Ellison, Senior SEO Content Strategist, Orderbox
It’s also wise to present a conservative base case as your primary recommendation to build trust with finance teams, while showcasing a best-case scenario as an upside. For high-cost implementations, use a 12–24 month horizon to account for compounding benefits as your team adapts and order volumes grow. Highlight savings from labor and error reduction, increased capacity, and even "soft gains" like avoiding warehouse expansion, fewer workers' compensation claims (adding 3–5% to total ROI), and better customer lifetime value from faster fulfillment.
"Operations should take the lead on calculating ROI... financial analysts may lack firsthand knowledge of warehouse operations and the less tangible benefits of automation." - OPEX
When presenting, focus less on abstract percentages and more on actionable benefits. Show how the investment resolves current pain points and prepares the company for future growth.
Metrics and Data Points You Need
Required Metrics for ROI Analysis
To calculate ROI accurately, you need to track specific metrics that tie directly to costs and savings. Start with labor metrics: instead of just counting staff, measure minutes per order to better understand capacity improvements. Even small time savings - like reducing steps in address validation or label printing using tools like Navexa and ShipStation - can add up to noticeable gains. Don’t forget to include your fully loaded labor cost. As of December 2024, U.S. warehousing employees earned an average of $24.00 per hour, which translates to a fully loaded cost of approximately $27–$31 per hour when benefits and other costs are factored in.
Next, focus on error and accuracy metrics. Manual picking typically achieves 97–99% accuracy, while automated systems can reach 99.5–99.9%. For throughput, document your order volumes for both average and peak periods, measure cycle times (from picking to shipping), and track pick density. When it comes to space utilization, note your warehouse lease rate - usually $8–$12 per square foot annually - and monitor how efficiently your cubic storage space is being used. Lastly, track shipping costs, including carrier fees, fuel surcharges, and labor tied to support tickets.
These metrics form the foundation of your ROI model, providing the data needed to validate cost savings and forecasted results.
| Metric Category | Key Data Points to Track |
|---|---|
| Labor | Minutes per order, fully loaded hourly rate, cost per pick, overtime hours |
| Operations | Order throughput, error rate, return rate, pick density |
| Inventory/Space | Inventory turnover, cost per square foot, storage volume (cubic) |
| Shipping | Average cost per shipment, freight savings %, shipping cycle time |
| Customer Service | Support ticket volume, minutes saved per ticket, refund rates |
Setting Up Baseline Measurements
Before implementing changes, gather several months of baseline data on throughput, accuracy, and labor to account for seasonal variations. Break down your fulfillment process into specific steps - like order review, packing, manifesting, and tracking setup - and time how long each step takes.
Use a spreadsheet to log monthly order volumes, order mixes, average handling times, and support ticket counts. When modeling new technology, assume it operates at about 80% efficiency during its first year. Document all assumptions clearly, such as an anticipated 60% error reduction, so your model can be reviewed and verified by stakeholders or finance teams. After implementation, measure performance at 30-, 60-, and 90-day milestones to compare actual results against your initial projections. These baseline metrics are essential for tracking progress and ensuring your ROI analysis remains consistent and reliable over time.
Conclusion
To calculate ROI for fulfillment technology effectively, focus on clear metrics, accurate baselines, and a well-structured process. Begin by identifying all costs, including upfront investment and ongoing operational expenses. Then, quantify savings in areas like labor, error reduction, and space optimization. Apply the ROI formula and validate your findings with methods such as the Simple Payback Period or Net Present Value to ensure your analysis meets the rigorous standards of a CFO’s review.
The key to reliable ROI analysis lies in using measurable data rather than assumptions. Incorporate metrics like minutes per order and fully loaded labor costs to reflect the actual impact. Take time to establish baseline measurements over several months, document your assumptions thoroughly, and track performance at 30-, 60-, and 90-day intervals. This allows you to compare real results against your projections with confidence.
FAQs
What discount rate should I use for NPV in my ROI model?
The discount rate for calculating Net Present Value (NPV) hinges on factors like your company's cost of capital, its risk profile, and industry norms. For e-commerce fulfillment projects, businesses often rely on the Weighted Average Cost of Capital (WACC) or a rate that mirrors the specific risk associated with the investment. To ensure precision, select a discount rate that aligns with your company’s financial guidelines or widely accepted industry benchmarks.
How do I estimate savings if my order volume is seasonal?
To figure out savings tied to seasonal order volumes, you’ll need to consider how your shipping activity changes throughout the year. Start by analyzing peak and off-peak periods based on your average monthly shipment volumes. Then, use this data to create a model that compares these fluctuations. By calculating an average or weighted savings estimate, you’ll get a clearer picture of potential cost reductions across different seasons. This approach can also help you fine-tune your fulfillment strategy for better efficiency year-round.
Which fulfillment metrics should I measure first to build a baseline?
Start by tracking essential fulfillment metrics such as operational costs (including labor expenses and error rates), throughput, and accuracy. These metrics give you a solid understanding of your current performance and highlight opportunities for improvement through automation. Establishing this data early creates a baseline to measure the effectiveness of any future technology investments.
Ship your next order through Navexa.
Connect a store, buy a label, and see the numbers yourself.